Future of COVID-19: Looking at Past Pandemics
Jared Klug, David Nemirovsky, Matthew Lawlor and Purnima Sharma
Overview
According to Google Trends, “coronavirus” is one of the most researched topics of 2020, having been searched four times as much as “news” between March and May of 2020. As we live through this ongoing pandemic, what might the most googled phobia be? Due to COVID-19, it is “the fear of other people”. So, a likely question on most peoples’ minds is how would COVID-19 take its course in the near future and possibly beyond?

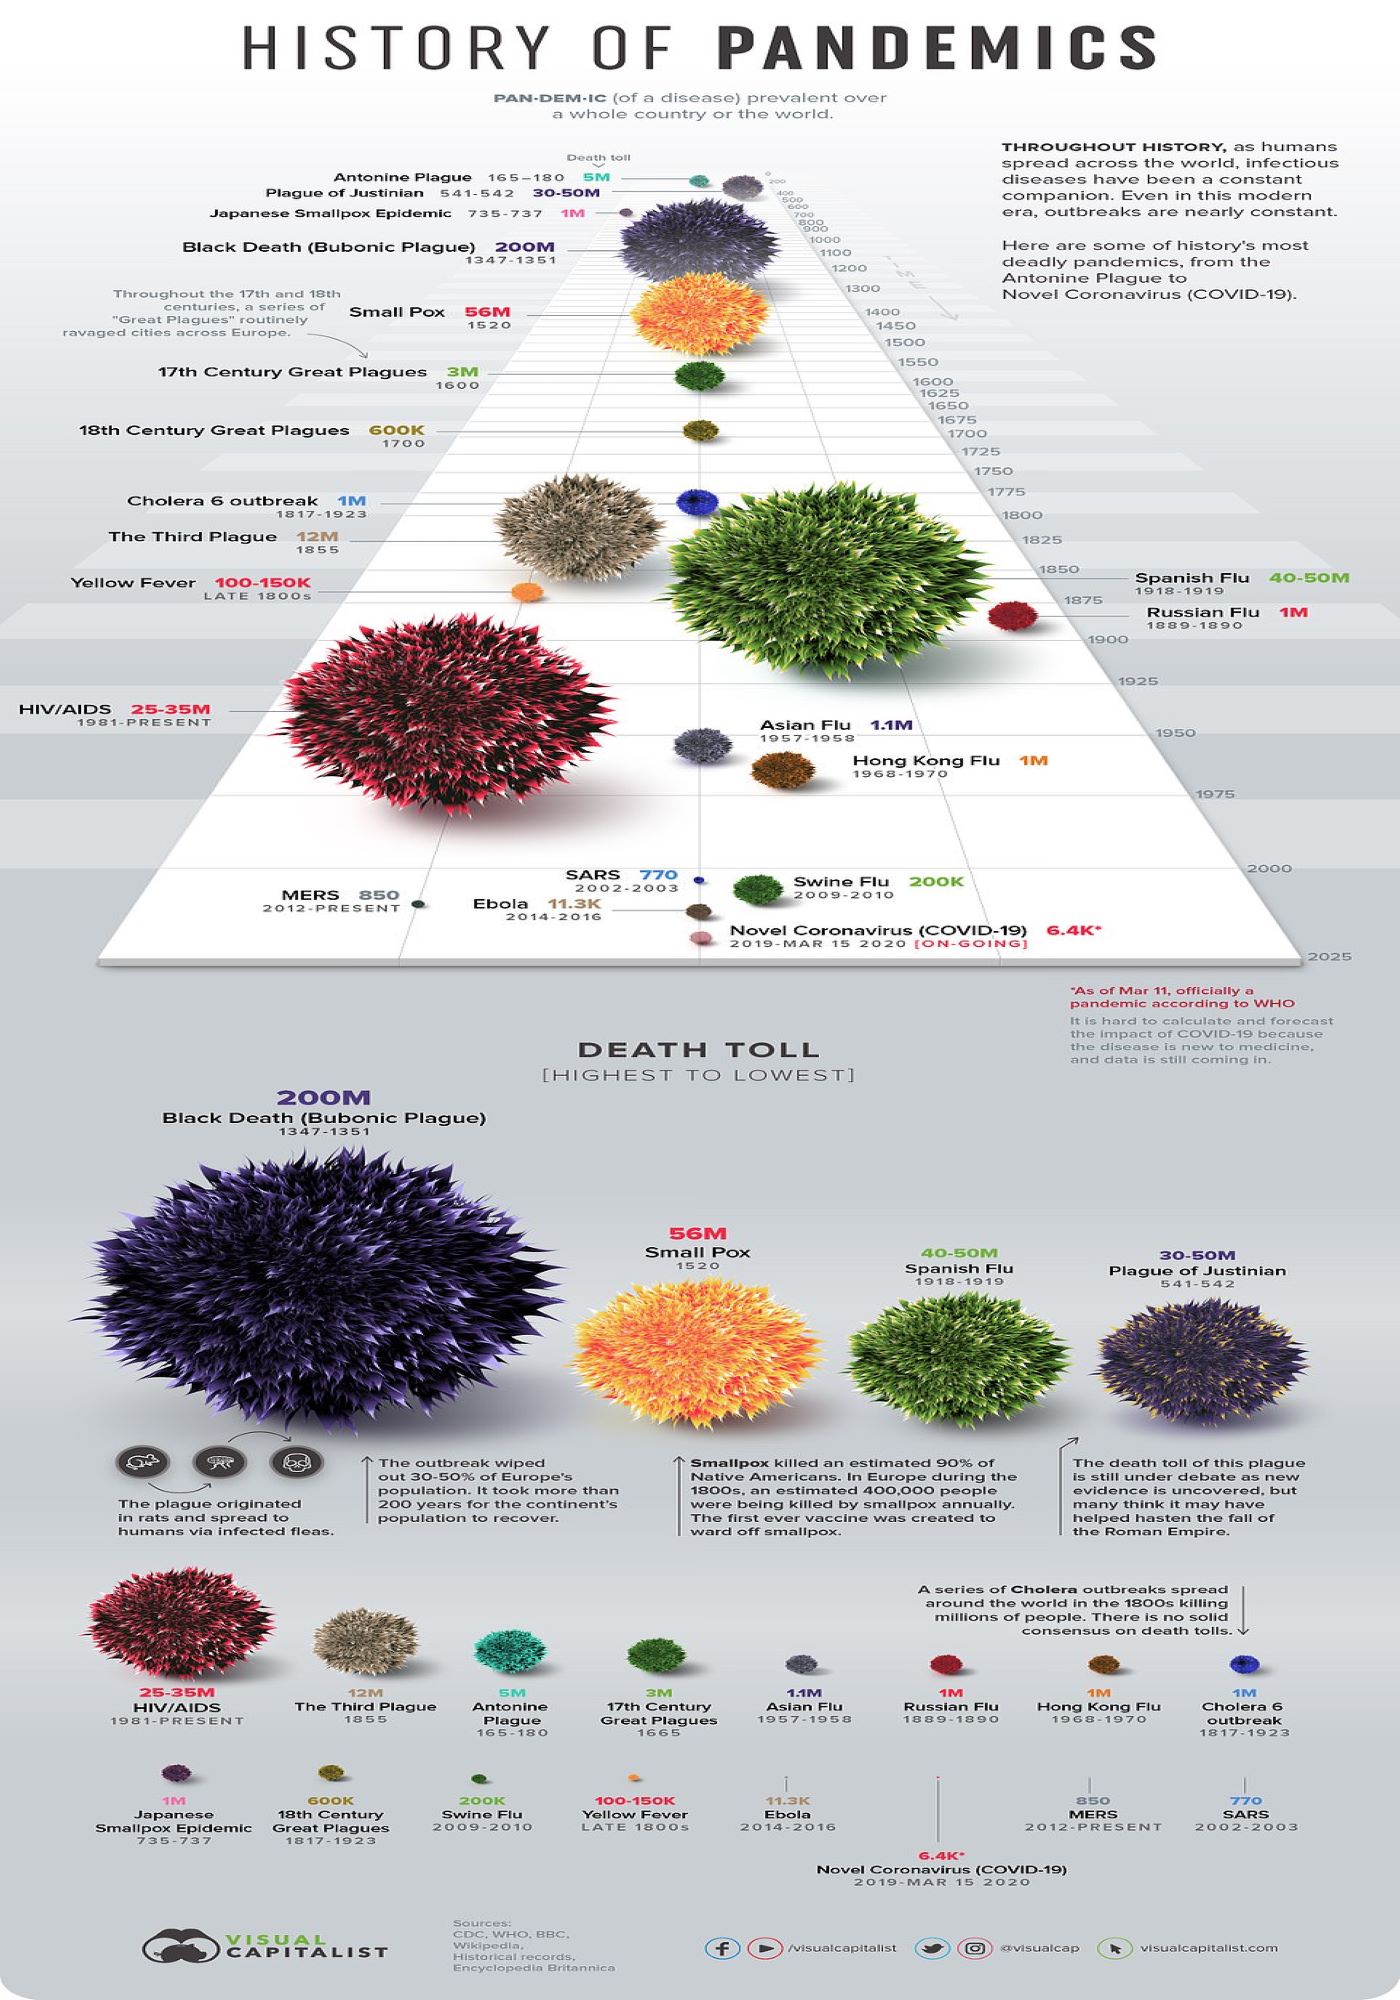
Given the nature of new Zoonotic infectious diseases, and the resulting inconsistent and sometimes conflicting measures of management of COVID-19 by the current federal government, we thought it would be interesting to explore into past pandemics in an effort to read into the current one. By looking at any prevalent patterns and similarities of prior pandemics, the aim was to learn lessons from those and shed some light on the direction of COVID-19.
Screencast Introduction
Data for the project was collected from various online sources such as kaggle.com, cdc.gov, and WHO.int/data for covid19 data. For a complete list of datasets and descriptions, click on the “Datasets” tab above.
Data comparisons for the project were performed between past pandemics and the current pandemic using similar and parallel, if possible, datasets (in terms of time-frame and geography of the spread). Comparisons were made by analyzing visuals and statistical parameters between the current and past pandemics.
The below plots show updated COVID-19 U.S. new versus cumulative cases and deaths. Death data is updated weekly, whereas case data is updated daily. The start of the pandemic duration was set to be January 22, 2020 (the first confirmed case in the U.S.).
library(tidyverse)
library(plotly)

load("rdas/covid_us_cases.rda")
load("rdas/covid_us_deaths.rda")

covid_us_merged =
  full_join(covid_us_cases, covid_us_deaths) %>%
  arrange(pandemic_duration) %>%
  relocate(pandemic_duration, covid_new_cases, covid_new_deaths) %>%
  pivot_longer(
    covid_new_cases:covid_new_deaths,
    names_to = "new",
    names_prefix = "covid_",
    values_to = "new_count") %>%
  mutate(
    new = recode(new,
                 new_cases = "New Cases",
                 new_deaths = "New Deaths")
  ) %>%
  pivot_longer(
    covid_cumulative_cases:covid_cumulative_deaths,
    names_to = "cumulative",
    names_prefix = "covid_",
    values_to = "cumulative_count") %>%
  mutate(
    cumulative = recode(cumulative,
                 cumulative_cases = "Cumulative Cases",
                 cumulative_deaths = "Cumulative Deaths")
  )

plot_new =
covid_us_merged %>%
   drop_na() %>%
   plot_ly(
    x = ~pandemic_duration, y = ~new_count, type = "scatter", mode = "lines", color = ~new) %>%
   layout(title = "COVID-19 U.S. New Cases and Deaths",
          xaxis = list(title = "Pandemic Duration"),
          yaxis = list(title = "Count"))

plot_cumulative =
covid_us_merged %>%
   drop_na() %>%
   plot_ly(
    x = ~pandemic_duration, y = ~cumulative_count, type = "scatter", mode = "lines", color = ~cumulative) %>%
   layout(title = "COVID-19 U.S. New vs Cumulative Cases and Deaths",
          xaxis = list(title = "Pandemic Duration"),
          yaxis = list(title = " "),
          legend = list(x = 100, y = 0.5))

subplot(plot_new, plot_cumulative, shareX = T, titleY = T)
Among the varying diseases the results showed some interesting patterns when compared, such as the s-curves of cumulative analysis and the waves pattern in recurrence of some of these outbreaks. Results also indicated devastation caused by each one, and the need for preparedness required at the very onset of infections caused by such novel pathogens as SARS-CoV-2, the new coronavirus. Analyzing the basic reproductive number (R0) of these diseases revealed their intensity, and the fact that COVID-19 ranked highest among them. Even though in reality R0, a measure of how contagious a disease is, is not a fixed entity, it is a good navigation tool to assist in managing pandemics, and realizing its values of past pandemics could help shed light on the tools that might have worked to contain them. The comparison showed us that even though R0 was slightly lower for Spanish flu, its toll was unmatched. Partly, probably due to the living conditions and hygiene levels of the time, and the fact that it was during World war I that might have aided its spread.
Even though quantifications might not be exact of many, greater understanding of past patterns helped realize possible directions COVID-19 could take. Our comparisons-Dashboard effectively compares COVID-19 to some of the prior pandemics in terms of total cases,mortality and fatality by region.
As the world changes blanketed by coronavirus, awaiting a solution, it might shape out as H1N1 did with its gradually diminished waves, or die down as Spanish flu eventually did. Our “full report page” analyzes these outcomes in greater depth.